Vast amounts of spatiotemporal data is generated nowadays both via simulations and measurements. Each simulation alone potentially has a large number of time steps, and how it evolves with different time steps is typically of interest in the analysis. The analysis of this data is not only challenging in terms of achieving the necessary performance to drive (interactive) data exploration, but also specifically regarding meaningful visual representations that help to answer certain research questions and eventually lead to new insight. To address both challenges, we generate aggregated, reduced representations that allow to study processes or events of interest across space, time, and potentially even variables, or other comparable simulations or measurements. We integrate approaches from traditional scientific visualization, machine learning, and high-performance visualization.
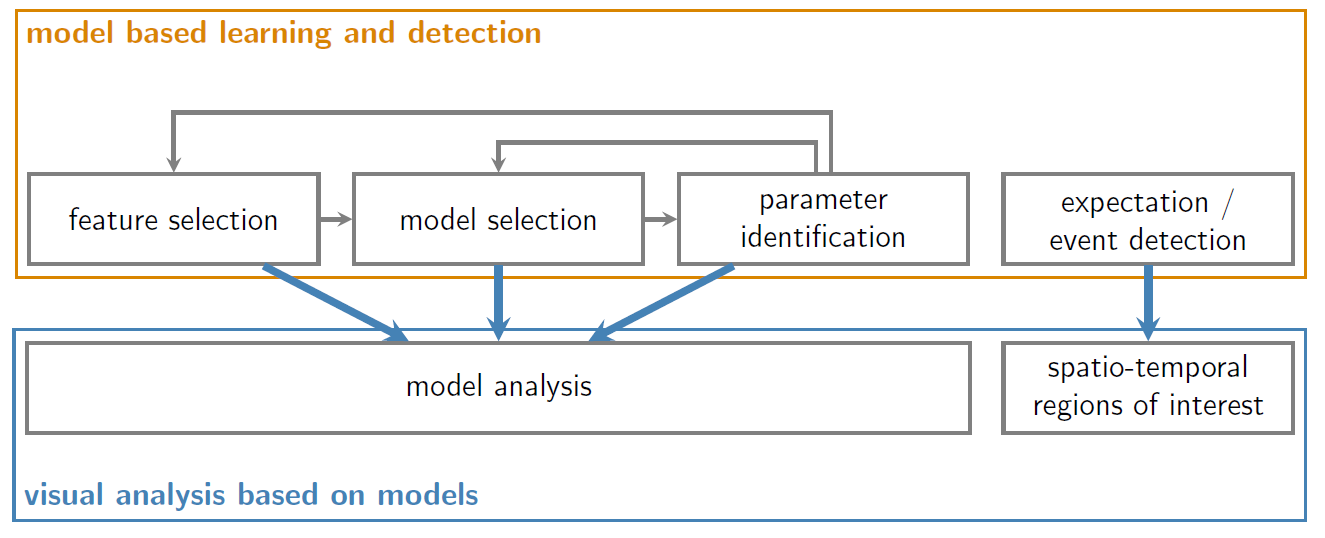
Specifically, we take a model-based approach, defining a model to explain processes of interest and learning its parameters from the data. The model depicts either (a) its expectations of what should happen in the data according to its understanding or (b) specific events of interest. In case (a), the model represents what is expected to deviate in the two data sets, while the residual from the model to the data set shows the differences to the respective expectation. In case (b), this directly provides the information where and when these events of interest occur.
Framework For Expectation Models
Model learning and detection
We use machine learning techniques to choose a model, adjust it, and determine parameters for it. For this, our learning procedure is composed of three nested loops: feature selection, model selection, and parameter identification. We then apply the result to our data, to either find deviations from this model or detect events of interest.
Visual analysis based on models
We use the constructed models for visual analysis in two regards. First, we look at the model itself, with the determined relevant features. Second, we particularly focus on visualizing the prediction of the models matched against the data.
Publications
-
Frey, S. (2017a). Sampling and Estimation of Pairwise Similarity in Spatio-Temporal Data Based on Neural Networks. In Informatics (Vol. 4, p. 27). Multidisciplinary Digital Publishing Institute.
-
Frey, S. (2017b). Sampling and Estimation of Pairwise Similarity in Spatio-Temporal Data Based on Neural Networks. In Informatics (Vol. 4, p. 27). Multidisciplinary Digital Publishing Institute.


