Visualization of Eye Tracking Data: A Taxonomy and Survey
Computer Graphics Forum Journal Publication 2017
Blascheck, Tanja; Kurzhals, Kuno; Raschke, Michael; Burch, Michael; Weiskopf, Daniel; Ertl, Thomas: Visualization of Eye Tracking Data: A Taxonomy and Survey. In: Computer Graphics Forum (2017) (Noch nicht erschienen).
STAR Proceedings of EuroVis 2014
Blascheck, Tanja; Kurzhals, Kuno; Raschke, Michael; Burch, Michael; Weiskopf, Daniel; Ertl, Thomas: State-of-the-Art of Visualization for Eye Tracking Data. In: EuroVis STAR, S. 63-82, 2014.
Institute for Visualization and Interactive Systems, University of Stuttgart, Germany.
VISUS, University of Stuttgart, Germany.
Abstract
CGF Journal (2017)
This survey provides an introduction into eye tracking visualization with an overview of existing techniques. Eye tracking is important for evaluating user behaviour. Analysing eye tracking data is typically done quantitatively, applying statistical methods. However, in recent years, researchers have been increasingly using qualitative and exploratory analysis methods based on visualization techniques. For this state-of-the-art report, we investigated about 110 research papers presenting visualization techniques for eye tracking data. We classified these visualization techniques and identified two main categories: point-based methods and methods based on areas of interest. Additionally, we conducted an expert review asking leading eye tracking experts how they apply visualization techniques in their analysis of eye tracking data. Based on the experts’ feedback, we identified challenges that have to be tackled in the future so that visualizations will become even more widely applied in eye tracking research.
EuroVis STAR-Proceedings (2014)
Eye tracking technology is becoming easier and cheaper to use, resulting in its increasing application to numerous fields of research. The data collected during an eye tracking experiment can be analyzed by statistical methods and/or with visualization techniques. Visualizations can reveal characteristics of fixations, saccades, and scanpath structures. In this survey, we present an overview of visualization techniques for eye tracking data and describe their functionality in principle. We classify the visualization techniques using nine categories. The categories are based on properties of the eye tracking data, including aspects of the stimuli and the viewer, and on properties of the visualization techniques. The classification of about 90 publications including technical as well as application papers with modifications of common techniques are described in more detail. We finally present possible directions for further research in the field of eye tracking data visualization.
Material
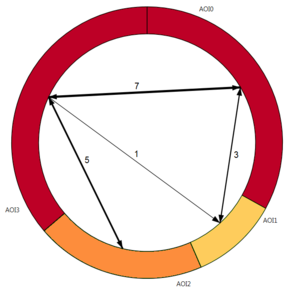
Exemplary Visualization Techniques for Eye Tracking
Literature
Burch, Michael; Kull, Andreas; Weiskopf, Daniel: AOI Rivers for Visualizing Dynamic Eye Gaze Frequencies. Computer Graphics Forum (CGF). 31 (3.3), p. 281-290 (2013).
Kurzhals, Kuno; Weiskopf, Daniel: Space-Time Visual Analytics of Eye-Tracking Data for Dynamic Stimuli. IEEE Transactions on Visualization and Computer Graphics (TVCG). 12 (19), puter Graphics (TVCG) 12 (19), S. 2129-2138 (2013).
Blascheck, Tanja; Raschke, Michael; Ertl, Thomas: Circular Heat Map Transition Diagram. In: Proceedings of the 2013 conference on Eye Tracking South Africa, p. 58-61 (2013).
Raschke, Michael; Chen, Xuemei; Ertl, Thomas: Parallel Scan-Path Visualization. In: Proceedings of the 2012 Symposium on Eye-Tracking Research and Applications, p. 165-168 (2012).


